
Flowchart
Last updated:
Mermaid Studio provides the most comprehensive flowchart support of any IntelliJ plugin, turning your IDE into a first-class editor for process flows, decision trees, and system workflows. Flowcharts are the most versatile diagram type in Mermaid.js, and every piece of IDE intelligence in Mermaid Studio — completions, refactoring, inspections, Code Vision, and the Style Pane — is tuned for them.
Syntax Highlighting
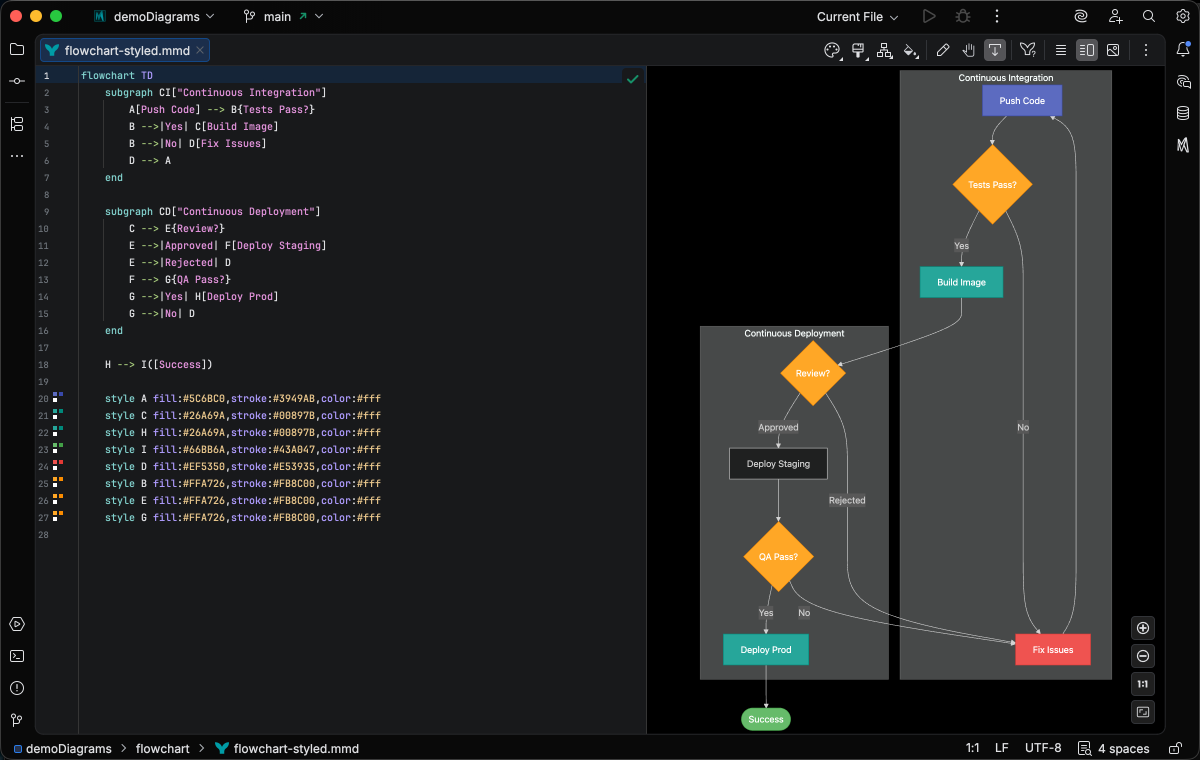
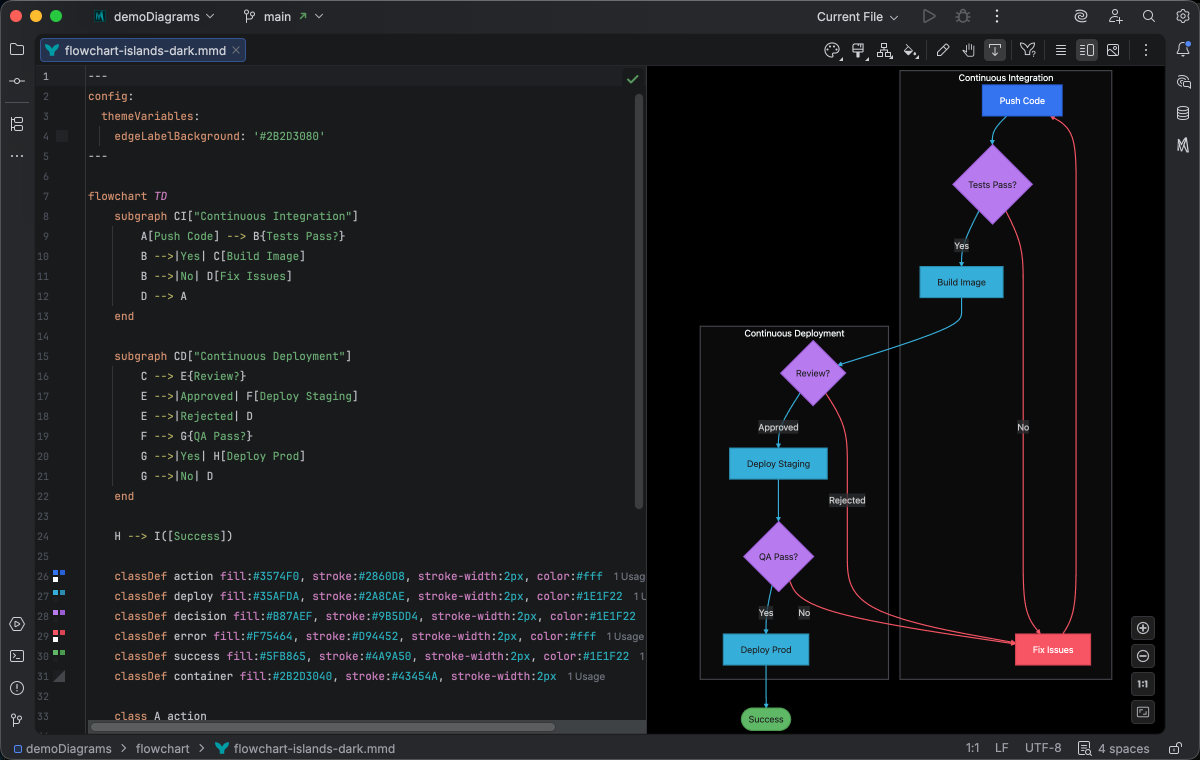
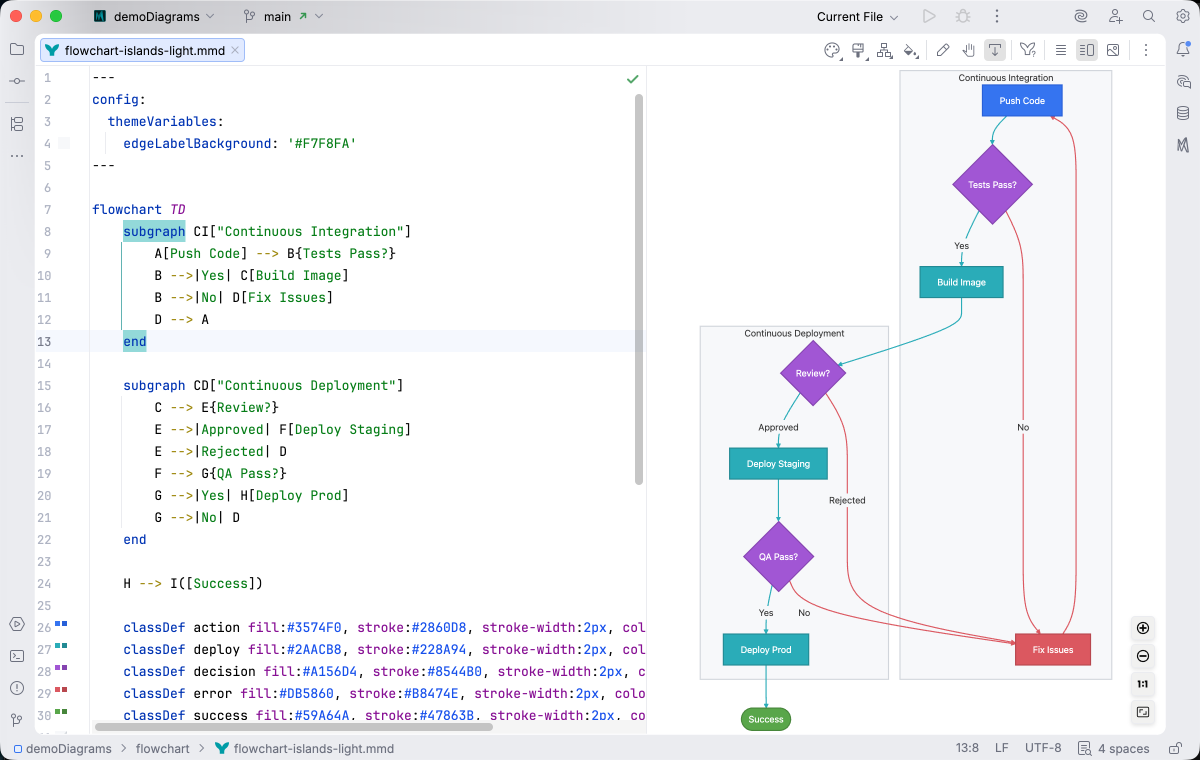
Section titled “Syntax Highlighting”Syntax highlighting integrates directly with IntelliJ’s color scheme system, so diagram colors always match your editor theme.
IDE Support
Section titled “IDE Support”The summary below shows the IDE support Mermaid Studio ships for flowcharts, grouped by capability.
Folding lets you collapse and expand structural blocks of the diagram source (subgraphs, frontmatter, multi-line strings) directly in the editor gutter. It keeps long diagrams navigable without forcing you to scroll past detail you don’t need right now.
Use the gutter triangles, Code → Folding, or the standard JetBrains shortcuts (
When the cursor sits next to a bracket, brace, or paren, Mermaid Studio highlights its matching pair across the whole diagram and lets you jump between them. This is especially valuable in nested syntax (subgraph blocks, JSON-style style strings, multi-shape labels) where it’s easy to lose track of which closer goes with which opener.
The line-comment action (
When you type a quote character to start a string, Mermaid Studio inserts the matching closing quote and places the cursor between them. Backspacing through an empty pair removes both characters at once. This keeps quoted labels balanced and reduces fiddly cursor work.
The formatter rewrites your diagram source to a canonical layout (consistent indentation, alignment of multi-line links, normalized whitespace around operators) without changing semantics.
It also clears up the whitespace mistakes that the Mermaid.js parser is picky about, normalizing spacing between tokens so the parser accepts the diagram on the first read instead of throwing a confusing syntax error.
Run it with Code → Reformat Code (
Pressing
A dedicated Grammar-Kit parser backs the highlighting, so tokens are colored by what they mean in the diagram (a type reference versus a label versus a style), not just what they look like. The same parser validates the syntax as you type, flagging malformed statements in place instead of letting one mistake cascade through the file.
This is the foundation richer features build on; the same grammar drives completions, refactoring, and inspections.
Per-diagram annotators apply rule-based highlighting above the lexer and parser, running on every keystroke and painting their results directly in the editor. Mermaid Studio uses them across the full range the platform supports: highlighting that token types alone cannot decide (coloring a reference by what it resolves to), semantic errors and warnings (an edge pointing at an undefined node, an invalid direction value), and inline cues such as marking duplicate labels. Unlike inspections (configurable checks listed in Settings), annotators are always on, whether a rule ends in a color or a warning.
As you type, Mermaid Studio offers context-aware suggestions filtered to what’s valid at the cursor: node shapes, arrow types, keywords, icon names, identifiers, frontmatter keys, theme variables, and more. Completions cut down on typos and make the diagram syntax self-documenting.
Completion and validation for the YAML frontmatter block above the diagram body, driven by the diagram type’s slice of the Mermaid.js config schema. Config keys, enum values, and color properties complete as you type, and unknown or mistyped keys are flagged in place.
Hex, named, and rgb()/hsl() colors in style declarations get a small color swatch rendered in the gutter.
Click the swatch to open the IntelliJ color picker and pick a new value, and the source updates in place.
A dedicated page under Settings → Editor → Color Scheme for the diagram type, listing every highlighting attribute its parser produces with a live preview. This is what makes the difference between “the theme colors it somehow” and “you decide exactly how keywords, identifiers, labels, and styles render”.
Inspections are static analyzers that run continuously and surface problems as you edit: duplicate IDs, undefined references, malformed syntax, deprecated patterns, missing required fields. Each inspection has a configurable severity (error, warning, info), can be suppressed inline, and most ship with a quick fix that resolves the issue with one keystroke.
This is where most of the editorial intelligence lives: a diagram type with rich inspections is much harder to break in subtle ways.
Rename refactoring (
Find Usages (
Code Vision renders small inline indicators above declarations, typically reference counts (“5 references”, “3 inbound edges”), so you can see at a glance how connected an element is without running Find Usages. Click an indicator to jump to the references list.
Hovering an element with
The Structure tool window (
Bundled and user-authored color themes with light and dark variants that apply to this diagram type from the Appearance menu or the Switch Diagram Theme action. Applying a theme writes the resolved theme variables into the diagram’s frontmatter, so the file renders the same outside the IDE.
Double-click an element to edit its label in place. The change is written back to the source when you commit it.
Inline-editable here: edgeLabel, nodeLabel, subgraphTitle.
Drag an element to a new position, rewriting the source order or layout hints to match.
Insert new nodes or containers from the toolbar, or drag a connection handle to empty canvas to create a connected element.
Drag an edge endpoint onto a different element to rewire the connection in the source.
Wrap a selection in a new container with
Remove the selected elements and their source, including batch deletion of a multi-selection.
A property inspector docked next to the preview that restyles the selected element (colors, presets, and diagram-type-specific controls) and writes the result back as Mermaid styling syntax.
Rename refactoring and find usages cover node IDs, subgraph IDs, CSS class names, and edge IDs across the whole diagram.
Go to Related jumps between a link and its linkStyle declaration in either direction.
Visual editing
Section titled “Visual editing”Flowcharts support the full visual editing surface. The toolbar’s Edit Mode toggle (pencil icon) flips the preview between preview mode and visual editing; the sections below cover the flowchart-specific actions available once it’s on.
Style pane
Section titled “Style pane”The Style Pane covers flowcharts as a first-class diagram type.
Styleable elements include individual nodes, subgraph containers, links (edges, with linkStyle support), and classDef definitions.
Preset gallery
Section titled “Preset gallery”The preset gallery lets you apply reusable styles to the selected element. Select a node or edge, then pick a preset from the gallery to apply its styles. Built-in presets cover common styling patterns; you can also save your own.
Node shape editing
Section titled “Node shape editing”When a flowchart node is selected, the Style Pane shows a shape editor with:
- Shape selector — choose from available node shapes with SVG icons showing each shape visually.
- Arrow controls — configure the direction of connections into and out of the node.
Shape changes are written back to the diagram source as the appropriate Mermaid syntax.
Link styling
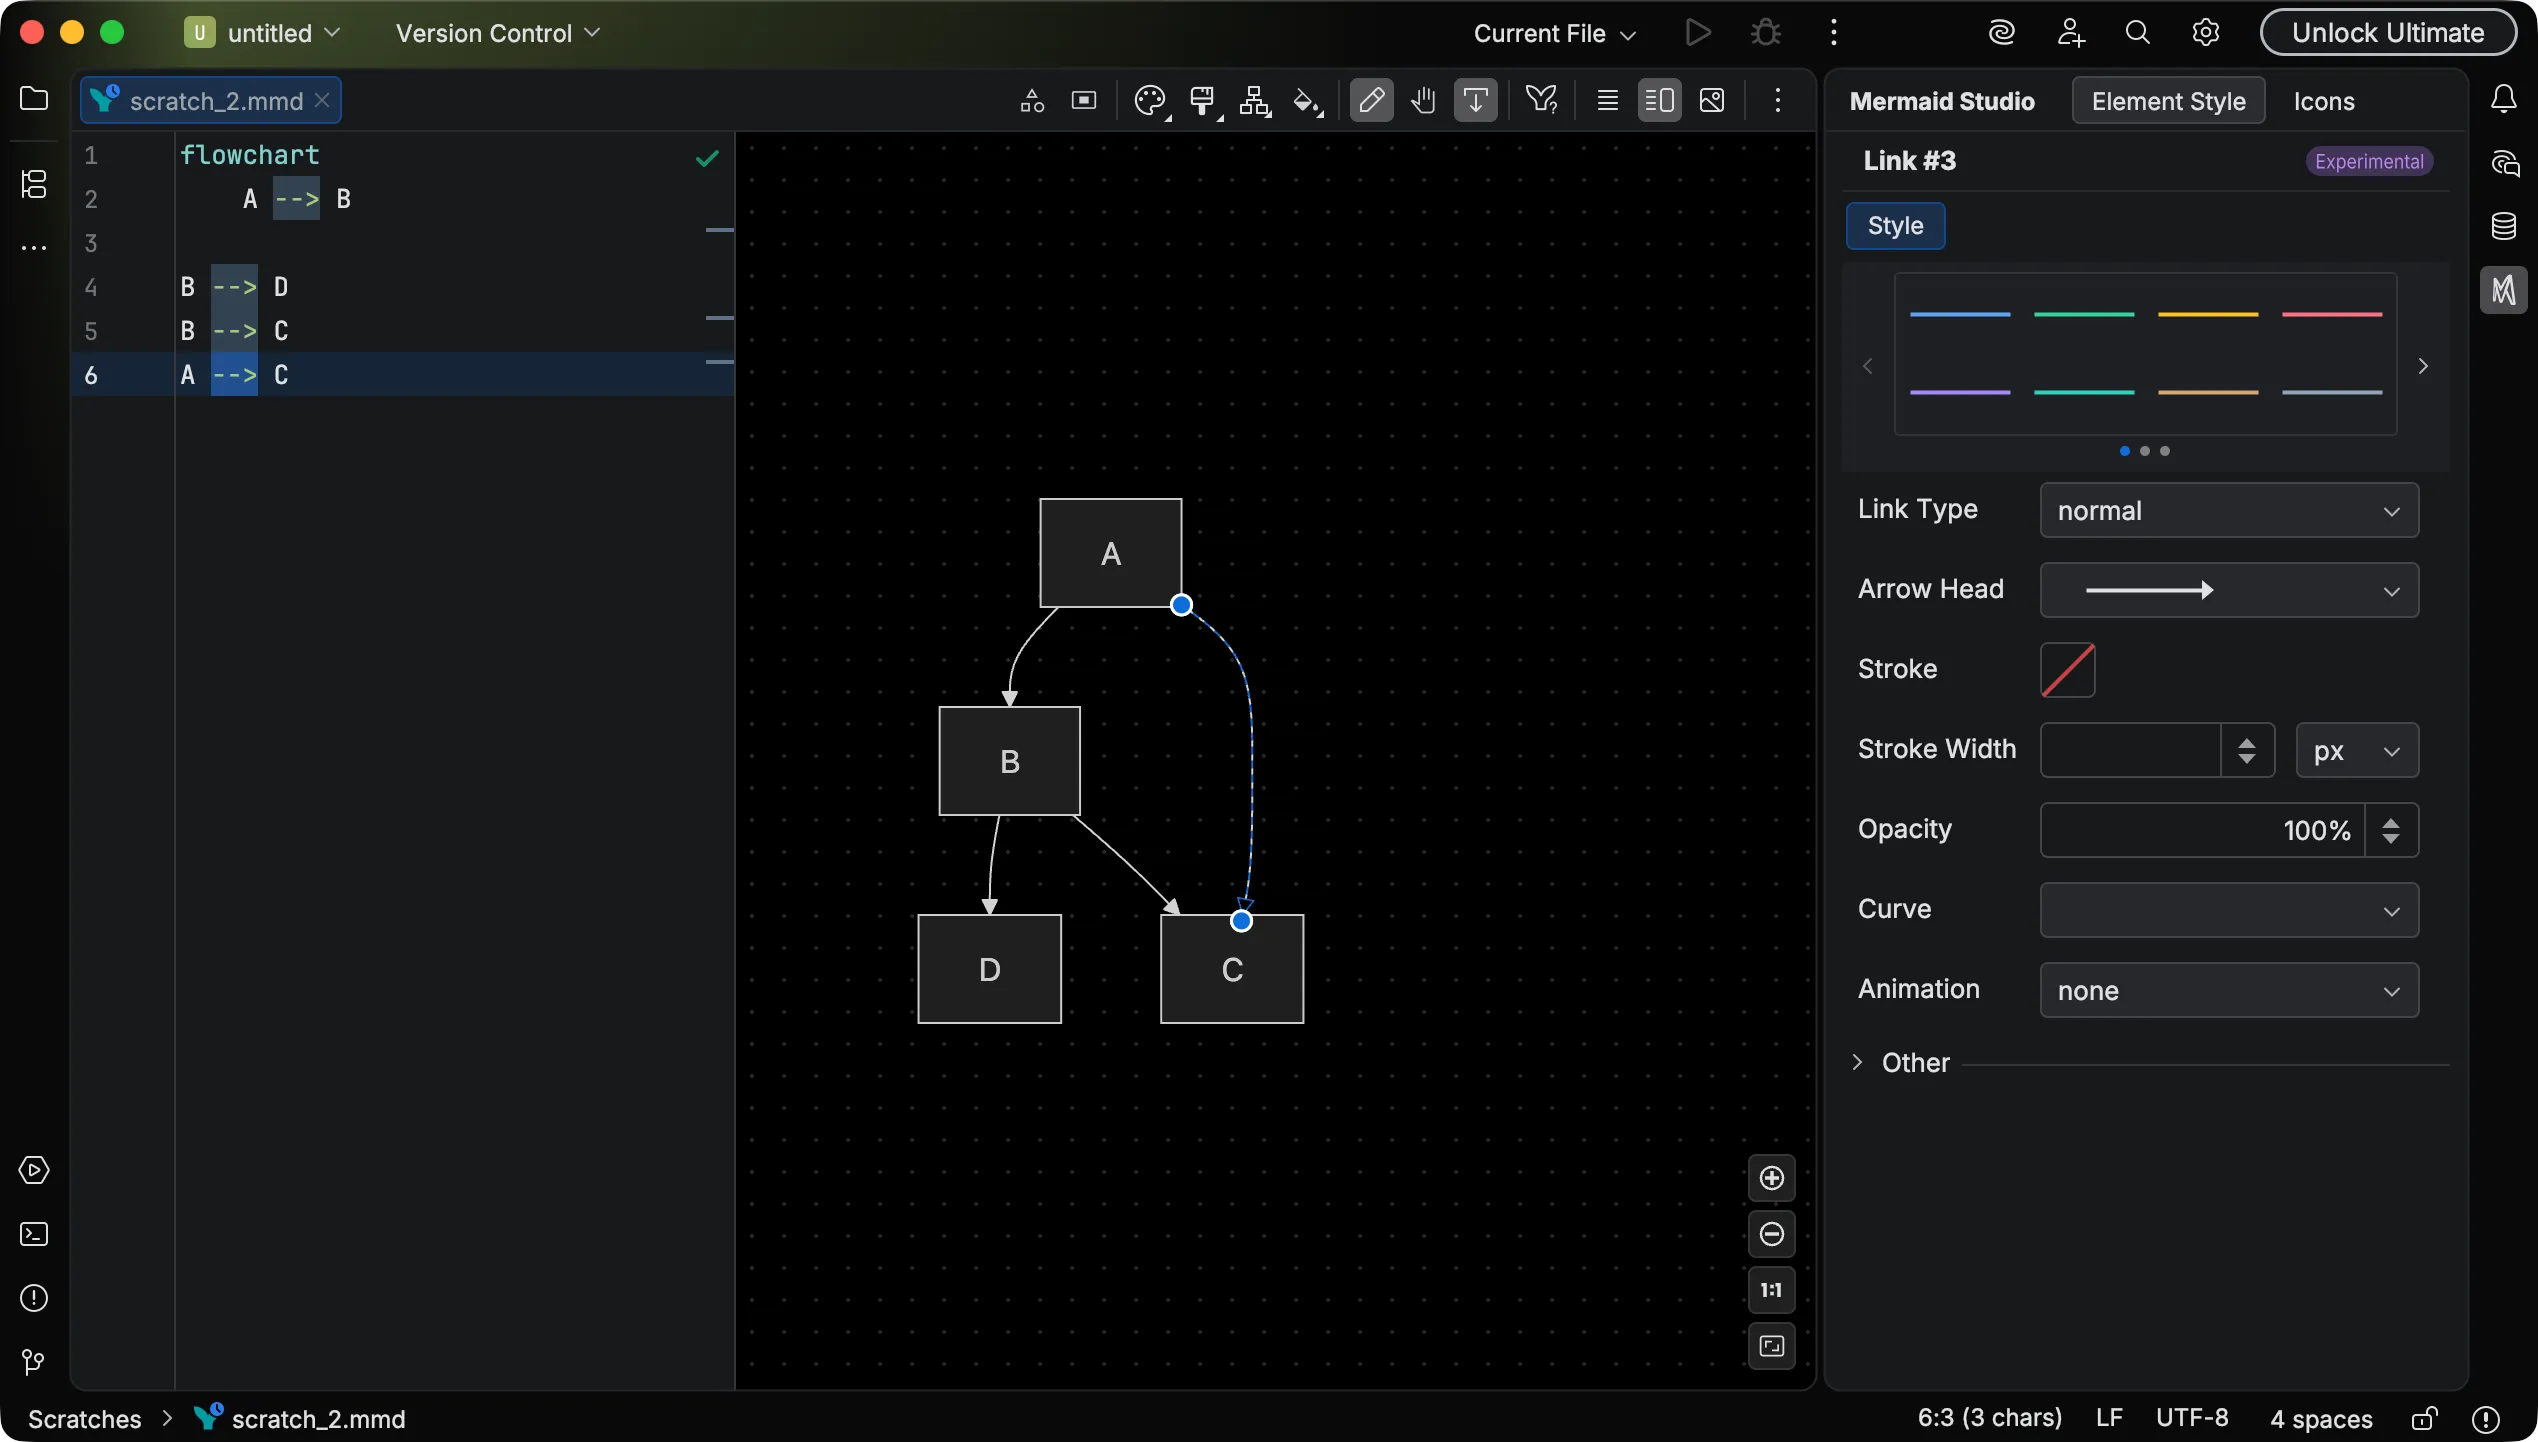
Section titled “Link styling”When a link (edge) is selected, the Style Pane shows link-specific styling controls.
Changes are written as linkStyle declarations in the diagram source.
If a linkStyle declaration already exists for the selected link, the Style Pane updates it in place; otherwise a new declaration is added.
You can navigate between links and their linkStyle declarations using Go to Related (
Click-handler properties
Section titled “Click-handler properties”When a node is selected, the Style Pane shows a Link tab for editing click-handler properties. This tab is only visible for nodes.
| Property | Description |
|---|---|
URL | The destination URL for the click handler |
Tooltip | Hover text shown over the node |
Target | Link target (_self, _blank, _parent, or _top) |
The Tooltip and Target fields are disabled until a URL is set.
Setting a URL creates a click statement in the diagram source (for example, click A href "https://example.com" "My tooltip" _blank).
If the node already has a click handler (including a JavaScript callback), it is replaced.
Clearing the URL removes the click statement entirely.
Adding nodes
Section titled “Adding nodes”Click Add Node in the toolbar to open the shape picker. The picker is organized into tabs (Basic, Process, Technical) showing the available node shapes with visual previews.
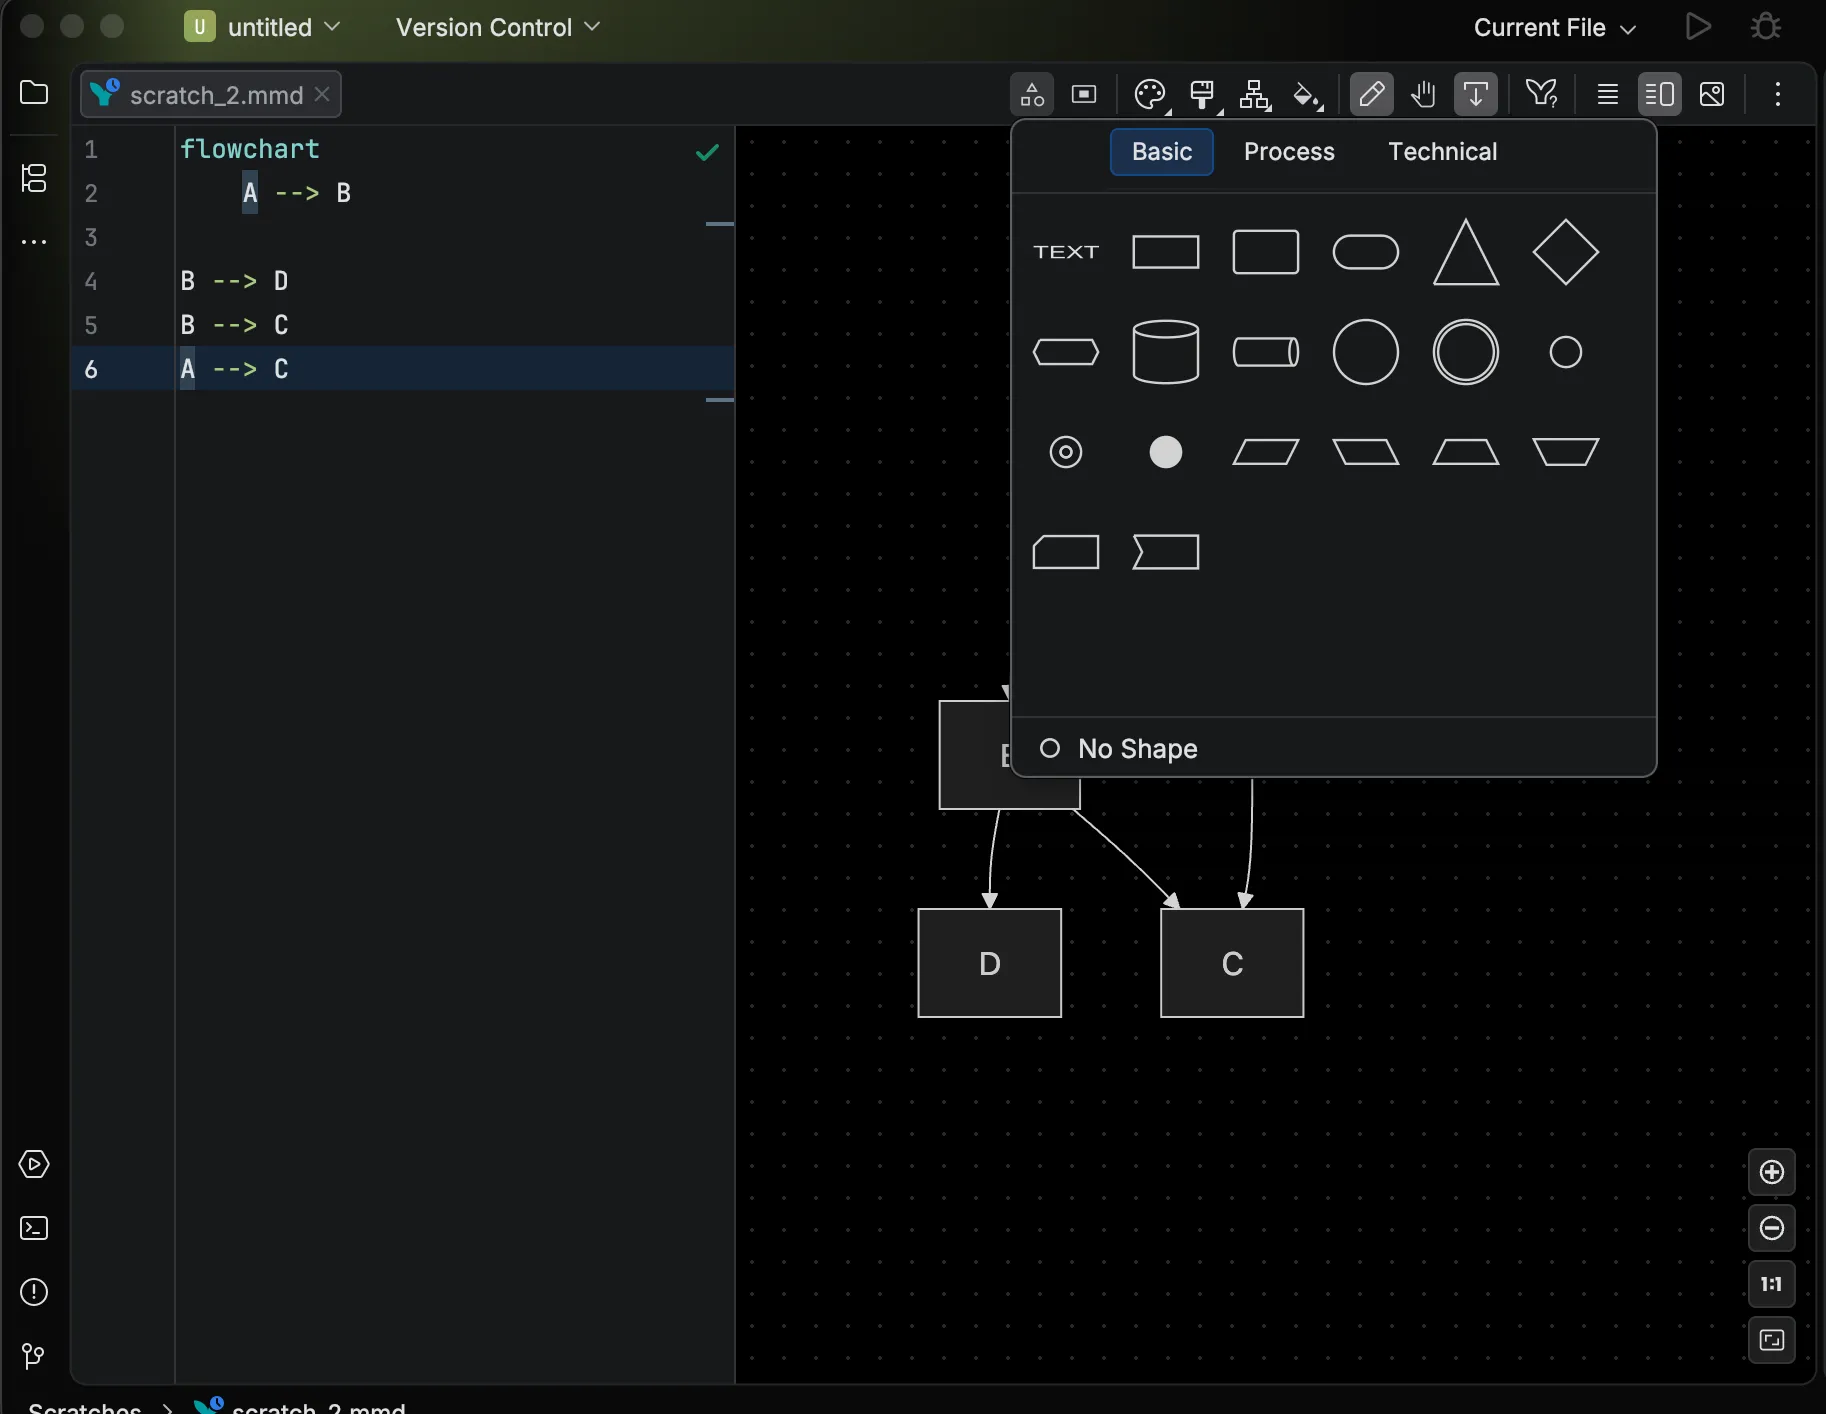
Select a shape to insert a new node into the diagram source. The editor caret moves to the new node so you can immediately type its label.
Adding subgraphs
Section titled “Adding subgraphs”Click Add Subgraph in the toolbar to insert a new subgraph container into the diagram source.
Drag to add with shape
Section titled “Drag to add with shape”Drag the connection handle on a node to an empty area of the canvas. A shape picker appears at the drop location, lets you choose the shape, then inserts the new node connected to the source node by a new edge.
Connecting elements
Section titled “Connecting elements”Hover over a node in edit mode to reveal a connection handle. Drag from the handle to a target node to create a new edge between them. The corresponding edge syntax is added to the diagram source automatically.
Edge retargeting
Section titled “Edge retargeting”Drag an existing edge’s endpoint to a different node to change where the connection points. The source code is updated to reflect the new target.
Moving elements
Section titled “Moving elements”Click and drag a selected node to reposition it. The source code is updated to reflect the new position.
- Moving nodes between subgraphs — drag a node into or out of a subgraph to change its scope. When a node crosses a subgraph boundary, the source code structure is updated accordingly.
- Moving subgraphs — click a subgraph to select it first, then drag. You can drag a subgraph into another subgraph to nest it.
With multiple elements selected, dragging moves all selected elements together as a batch.
Grouping into a subgraph
Section titled “Grouping into a subgraph”Select one or more nodes and press
Collapsing subgraphs
Section titled “Collapsing subgraphs”On Mermaid.js 11.17.0 or later, a subgraph can render collapsed to a single node, hiding its members until you need them.
Select one or more subgraphs in edit mode and press
Each toggle writes an id@{ view: collapsed } statement after the subgraph’s end line, or removes it, so the collapsed state is part of the diagram source and renders the same anywhere.
A subgraph that has only a title gets an id derived from that title first, since Mermaid.js otherwise addresses it by a position number that changes with every edit above it.
In the editor, completion offers collapsed and expanded for the view key, and a statement placed before the subgraph’s end gets a warning with a quick-fix that moves it.
Collapsing in the preview is separate from code folding in the editor, which hides the subgraph’s lines without changing the diagram.
Subgraph selection shortcuts
Section titled “Subgraph selection shortcuts”Alt + Shift + P AltShiftP Alt + Shift + P AltShiftP selects the parent subgraph of the current selection.Alt + Shift + C AltShiftC Alt + Shift + C AltShiftC selects all children of the currently selected subgraph.Alt + Shift + S AltShiftS Alt + Shift + S AltShiftS selects all siblings at the same nesting level as the current selection.
Inline label editing
Section titled “Inline label editing”In flowcharts, inline label editing applies to node labels, subgraph titles, and edge labels.
Double-click one, type the new text, and commit with
Quick Syntax Reference
Section titled “Quick Syntax Reference”Directions:
TDorTB- Top to bottomLR- Left to rightRL- Right to leftBT- Bottom to top
Node shapes:
[Text]- Rectangle([Text])- Stadium/pill{Text}- Diamond (decision)[/Text/]- Parallelogram (input/output)((Text))- Circle
For more shapes, use the shape definition syntax (e.g., A@{ shape: datastore }).
The full list of supported shapes is in the official Mermaid.js doucmentation.
Edges:
-->- Arrow---- Line-.->- Dotted arrow==>- Thick arrow-->|Label|- Arrow with textanimate A --> B- Animated edge
Subgraphs:
flowchart LR subgraph Backend API --> DB end subgraph Frontend UI --> API endA subgraph renders collapsed when a view statement follows its end line (Mermaid.js 11.17.0+):
flowchart LR subgraph infra [Infrastructure] LB --> App --> DB end infra@{ view: collapsed }For the complete syntax reference, see the Mermaid.js Flowchart documentation.